If you are bored over the holidays, here's something to keep you occupied for 2 hours.
Zz.
If you are bored over the holidays, here's something to keep you occupied for 2 hours.
Zz.
Fall 2022 semester is finally over! I've turned in all the grades, and I am breathing a big sigh of relief.
I only have myself to blame, but I can't take all the "credits" either. I taught two courses that I've taught before, but they both were using new Open Educational Resources (OER) texts. This means that I have to use all new lectures notes, set up new homework, quizzes, etc. And of course, being OER, the instructor support is barely there. I've mentioned already how unimpressed I was on what they call their "lecture notes". A dump of figures cannot be called lecture notes!
So this past semester, I had to basically do everything from scratch. And when you have two whole classes on different topics for that, I felt as if I'm behind at the beginning of each week! I'm used to producing extensive Powerpoint lecture notes with animations, videos, links, etc. I can't just use the old ones, mainly because of copyright issues, but also because I want my notes to be consistent with the notations, symbols, figures etc. that are used in their OER text. So each week, I have to produce brand new lecture notes, and since there's no support from the OER text, I have to do this from scratch. And we still haven't talk about quizzes, homework, etc. that I have to set up from scratch.
I never, ever, want to be in this situation again!
It was the closest I had come to being burnt out. I love teaching, and I gave up my career as a research physicist for this, but this past semester was the first time that I hated doing this. The joy that came from teaching did not exceed the aggravation. It didn't help that I was pissed at the dept. for shoving the OER texts and requirements on us without consulting us and asking the type of support that we would need. I was used to getting the type of instructor support from Pearson and Cengage, but this past semester, the rug was pulled from right under us and we were left with nothing.
What is actually rather amusing and funny is that the school is seriously pushing for our courses to try and adopt the Universal Design in Learning (UDL) standards, in which we accommodate students with various abilities, backgrounds, etc., and therefore, allow for our methods of delivery, assessments, etc. to be flexible and varied. The students portals at Pearson and Cengage had those, while the OER sources have practically zilch! So one part of the institution wants us to do one thing, while the other part removes the ability for us to do just that. The right hand doesn't know what the left hand is doing!
Yes, I'm venting. For my own sanity, I need to air out my frustrations at this whole silliness. I have no doubt that the standards that I set for myself for these classes suffered this past semester, and I'm not happy about it. Now I just need to figure out how to prepare way in advance for next semester. Luckily, I'm teaching only ONE class using OER text, and it is the same one that I taught this past semester. Hopefully, I'm more prepared.
Wish me luck!
Z.
So the big news of the week, which was preceded by the rumors a few days before the official announcement, is the breakeven achievement in a fusion process at Lawrence Livermore's National Ignition Facility (NIF).
This is certainly a major breakthrough, and it is something that has achieved for the very first time ever in a controlled experiment (it happens all the time in our Sun and other stars). However, to me, this is more of a proof-of-principle experiment, meaning that it is a demonstration that it is possible, rather than to show that it is viable. It is certainly very, VERY far away from producing anything useful because harnessing this energy is an entirely different matter.
While you can read many sites reporting this, I kinda like the one that I read on CNET because there's a certainly level of sensibility aimed towards the general public. In particular, there is this definition of what is meant by "breakeven":
More specifically, scientists at NIF kickstarted a fusion reaction using about 2 megajoules of energy to power the lasers and were able to get about 3 megajoules out. Based on the definition of ignition used by NIF, the benchmark has been passed during this one short pulse.
But that doesn't convey the whole thing, because this is what should also be mentioned:
"The calculation of energy gain only considers the energy that hit the target, and not the [very large] energy consumption that goes into supporting the infrastructure," said Patrick Burr, a nuclear engineer at the University of New South Wales.
What it means is that they only considered the energy of the laser hitting the target, and then finding the energy output from the ignition that subsequently resulted in fusion. Sure, that energy output is greater than the input energy of the laser, but this is not the total energy of the entire facility that created the laser. That facility would still not be self-sufficient to run just by using the output energy of the fusion it created, even assuming 100% efficiency.
This does not diminish the amazing achievement, considering that other facilities and techniques have not even reach this level. It is just that it needs to be tampered with a bit more realistic expectations so that we don't oversell ourselves to the public.
Zz.
Don Lincoln has produce another fun video on the speed of gravity.
SPOILER: It has the same speed as the speed of light!
But what is more interesting in this video is a brief description of LIGO and gravitational interferometry and how gravitational waves are detected.
Enjoy!
Zz.
It is not know if the public is aware of the economic impact of physics, not just in terms of industry to support the workings of physics, but also how new ideas and technologies have sprung new innovations and devices that made our world the way it is today. Of course, the most obvious example would be the invention of the solid state transistor, which is the heart of every modern electronic devices that we have now.
This Swiss study tries to quantify the impact of physics on the Swiss economy. One can clearly see the breath of the impact across many different disciplines and sector of the economy.
This is not that much different than the previous similar studies that were done for the US economy and for Europe. The significant conclusion one can draw out of these data is that one gets a lot of returns for the initial investment. But it is not just that. If one looks at the nature of the returns, many of them are vital to the advancement of our civilization, so these investments are important not merely for financial reasons.
BTW, I still encounter people (a few of them my students) who are surprised that physics has anything to do with their smarphones.
Zz.
In case you want to know our current view on how we came into being, here's a brief article on how we currently understand how the universe was created.
It's too bad he doesn't go into the evidence that we have to support each stage of the formation of the universe. Of course there isn't much to go by in term of good evidence for anything less than 380,000 since the Big Bang, but the CMB is such a strong evidence that it should have been elaborated.
Zz.
Most of you know this already, but it is always helpful to remind people on how quantum physics, as esoteric of a subject as it is, is the key to understanding many of the devices that we use everyday and take for granted.
The only drawback here is that the article listed only three, when there could be plenty more.
Zz.
I mentioned a while back that the dept. is migrating to using Open Educational Resources (OER) texts this coming Fall. I'm all for it because the texts are quite reasonable and it will save the students a lot of money when their textbooks are free.
I'll be teaching two different courses that use to different OER texts out of OpenStax. I'm so freaking glad that I looked at the so-called lecture materials that accompanied each of these texts early this month because I would have been in a panic mode if I were to start preparing just 2 weeks before classes start! This is because the PowerPoint lecture materials are nothing more than a collection of the figures from the texts. That's it!
My first reaction when I first opened them was "What the......?"
Then blood drained from my face because I realized that I had to produce the lecture notes from scratch for both classes! And I had 3 weeks to do that!
Now you could tell me that I can just copy the lecture presentations from the same course that I had taught previously. True, but I want to stick with the content of the texts that the students will be using, especially in going over the same examples, using the same notations and format, etc. I want to use the same symbols for the various quantities that we will be using, so that the lecture presentation is consistent with the text. So I can't just copy old lecture notes verbatim, and I certain have to change the examples to match the examples in the text.
But even that is not that easy. My PowerPoint presentations often have links, animation, and other interactive stuff that are specific to that text and course. We were using Pearson's Mastering Physics, and I used quite a number of their videos to illustrate various physics principles. I can't use that anymore because those are copyrighted to Pearson and to be used only with their material. This means that I have to redo the animation and find new videos to include in the lecture presentation.
I did a Google search online to see if there are lecture notes using these two textbooks. There are, but all the ones that I have encountered so far are in PDF, meaning that I could not modify them to suit my needs.
Ugh! This semester is going to be a nightmare! I hate not already be prepared by this time!
This is why you haven't seen a lot of blog posts from me these past few weeks. Sigh....
Zz.
Many people think that Classical Physics and Relativistic Physics are two different things. Of course, anyone who has studied both can tell you that one can derive many of the classical physics equations from relativistic equations, proving that classical equations are actually special cases of the more general relativistic equations.
In this Don Lincoln's video, he shows how classical kinetic energy that many students learn in General Physics courses can actually be derived from the more general relativistic energy equation, and why we still use the classical physics equation in most cases.
Z.
This is a rather cool experiment.
They have a direct observation, for the first time, of electrons behaving like an ordinary fluid and exhibiting vortices when going thorough a channel.[1]
In contrast, electrons flowing through tungsten ditelluride flowed through the channel and swirled into each side chamber, much as water would do when emptying into a bowl.
.
.
“That is a very striking thing, and it is the same physics as that in ordinary fluids, but happening with electrons on the nanoscale. That’s a clear signature of electrons being in a fluid-like regime.”
So far, "ordinary" electron flow behaves like a "Fermi liquid", which is not like ordinary fluid flow. To get electrons to behave this way, they had to make sure that the electrons do not bump into the crystal lattice (the bulk material), so this is not easy since normal-state electrons usually have such interaction (non-zero resistivity).
Just to be clear, this is not the first observation of electrons exhibiting vortex flow. This is a common observation when they are in a superconducting state, where vortices form around magnetic flux lines that penetrates Type II superconductors. But in that case, these electrons are in a superfluid, and what is flowing is the paired electrons (Cooper pairs).
In this experiment, these are individual electrons not in a superconducting state, so this truly is a river of electrons.
Z.
[1] A Aharon-Steinberg et al., Nature 607, 74 (2022).
Previous posts:
My favorite web applications - Part 1
My favorite web applications - Part 2
My favorite web applications - Part 3
My favorite web applications - Part 4
My favorite web applications - Part 5
Continuing on with my pet project here, this next web application is actually another one of those that closely mimics an actual experiment. This time, it is on specific heat, and the goal here is to measure the specific heat of an unknown liquid. You do this by measuring the mass and temperature of the unknown liquid, and then mixing it with hot water of known mass and temperate. By finding the final equilibrium temperature, you then calculate the specific heat of the unknown liquid.
Like I said, this web experiment is done step by step just like a real experiment. In fact, you could use this as the lab instruction and get the students to follow each step of the experiment. But what I like the most is that each student will be given a different set of numbers to work with. The masses will be different, and so will the starting temperatures of the liquid, resulting in different final temperature as well. I don't remember if the specific heat of the unknown liquid is also different for different students. Please let me know if you've used this app or if you discover this later on.
I used this as one of my virtual labs when we went remote. But I continue to use this after we gone back to face-to-face classes as part of my in-class problem solving exercises. I've also given this as a take-home homework problem, and they have to show the final acknowledgement page that they got this correct if they want to receive credit for it. If the students have done the actual experiment itself, this web application will be quite familiar and they should have a good clue on how to correctly find the unknown specific heat.
Zz.
I'm teaching a physics course with labs over the summer. And if you've taught Summer courses, you know that they go very fast and furious, so I'm not sure if there's any chance for any evaluation on the effectiveness of anything.
I mentioned a study a while back that seems to imply that it is better for students, especially minorities and marginalized students, to share lab work and have equal access to every part of the experiment, rather than splitting responsibilities and have each students just do one part of it. I am still unsure of how effective it is or whether I can tell if it is working, but I've made sure that the students know that no one is to do just one part of the experiment, that everyone must take turns doing different parts of the experiment.
Much to my surprise, the students seem to be amicable about it. So far, I've seen everyone taking turns and rotating themselves to different tasks as they perform the experiment. Better yet, I've seen students helping and teaching other students on what they just learned about doing certain parts of the experiment or in performing the analysis of the data.
One direct result that I've seen so far is that everyone in the group knows how to work and setup the computer interface to connect to the various sensors, whereas in previous classes, I've noticed that the same students had the responsibility of setting up the sensors. Already, I can tell that the students are learning about conducting the whole experiment rather than only certain parts of it.
I did not plan on doing any form of assessment on how beneficial or effective this is, because I had not run any control study before. Besides, it is a summer session, and "rushing" is the most common theme for a physics summer class.
I don't know if this will boost the students' "self-efficacy" but from simply a superficial observation, I can see the benefit of requiring that the lab work be shared rather than split.
Zz.
Previous posts:
My favorite web applications - Part 1
My favorite web applications - Part 2
My favorite web applications - Part 3
My favorite web applications - Part 4
This time, it is an experiment that mimics the fabled Archimedes experiment where he supposedly determined for the "king" whether the crown was made of pure gold or not. This web application basically allows a student to perform a similar virtual experiment to determine the density of the object being investigated.
There are two reasons why I like this app. The first reason is that if you change the default settings for the mass and the volume, you will given rather random values. This means that each student will have different values for the mass and volume, resulting in each student having a unique set of data and calculation.
The second reason why I like this "experiment" is that it actually is the same experiment that we would do in a f2f lab. We use PASCO's Capstone system, and one of the experiments that we do is practically identical to what is shown in this virtual experiment, where a student has connected a weight sensor to a hanging mass, and then he/she slowly lowers it into a beaker of liquid. The sensor sends a reading of the hanging weight value to a data collection system that plots the value of the weight in real time. As the weight is lowered into the liquid, the data being plotted looks almost exactly as what is shown in the virtual experiment in this app. The weight changes due to the buoyant force of the liquid.
The analysis of the experiment and the extraction of the value of the object's density are similar for both the f2f lab and this virtual lab. So in that sense, the student is not being deprived of much of the physics. There are, of course, more errors involved in the real experiment because often the object isn't hanging still, and the movement adds more noise to the data. The app doesn't allow the data to be extracted directly, so no curve fitting or calculation of average value can be made for a range of the data points, something the students in the f2f lab are asked to do to be able to determined the weight before and after immersion.
Still, it is an adequate virtual experiment, especially since each student will have to do his/her own analysis on a unique set of measurement. I actually have used this as part of an assessment where this app was part of an exam for a f2f class (before the pandemic). The student had already done the actual experiment, so they should be familiar with how to find the density of the object using this app since things should look rather familiar.
Zz.
For the past couple of years, the school has been pushing various departments to start adopting Open Educational Resources (OER) for various courses to help reduce educational costs to students. It has finally trickled down to our department where, starting this coming Fall, the General Physics courses will start using OER texts for the first time.
I have zero problem with doing this. I remember when I was a student, textbooks were hugely expensive. Adopting OER texts for General Physics courses will save students quite a chunk of change, especially if they, or their parents, are footing the costs.
The only issue I have is that, using texts from various publishers doesn't stop just at the textbook itself. I've been using Pearson and Cengage for General Physics texts, and they come with their online services consisting of the e-text and homework/quizzes capabilities.
But even that does not convey everything. Both Cengage and Pearson's website offers rather substantial student support that I have made used of, especially when we went remote. When I assign homework on Pearson's Mastering website, for example, I often select one or two "tutorial" items. These are questions in which, if the students are stuck, there are guided hints and prompts to help students overcome the barrier or difficulty at that stage. I find these types of tutorial very useful for the students and often had the students attempt one of them during class session.
The other thing that I find useful is the "adaptive learning" feature. I can set it up so that if a student struggled with one problem and finally thinks that he/she understood how to solve it, it will prompt the student to solve a similar problem to that one to see if the understanding can be nailed down. The student then has the chance to really test his/her understanding in solving the similar problem, and I can see for certain of the student's progress.
Unfortunately, none of these extensive feature are available in any of the OER sources. These features were extremely useful during remote learning where I'm not there to help the students in person. Yet, these features gave real-time feedback on how the students are doing and assisting the students in solving the problem, all done automatically without needing my intervention. These are what I will miss when I start using OER texts because so far, from what I can see, they only provide the text and maybe a set of homework questions, and that's it. It is no different than the old-fashioned way when I was in college, except that these are in electronic form.
It is still months away from the start of the Fall semester, but I'm already thinking and planning ahead on how to approach this. We will definitely be back to in-person instructions, so maybe the need for all the bells and whistles of online capabilities might not be as great as it is now. Still, I'm anticipating a few hiccups as I dive into a new set of challenges in running a class.
Stay tuned....
Zz.
The physics of high-Tc superconductors (or the cuprate superconductors) continues to be elusive. After its first discovery in mid 1980's, a coherent and consistent theory on why this family of material becomes superconducting is still up for debate. There are candidate theories, but we do not have an accepted consensus as of yet.
One of the main reason for this is that this is such a rich and complex material, exhibiting so many different characteristics and puzzles. As a result, different versions of theories are competing to describe as many of the experimental results as possible. But the target is also moving. As our instrumentation improves, we are discovering new, more subtle, and more refined behavior of these material that we haven't seen before.
The existence of the so-called pseudogap in the cuprates is well-known. I've posted several articles on them. This is the gap in the single-particle spectral function that opens up well above the transition temperature Tc. In conventional superconductors, the formation of this gap coincides with Tc, below which the material becomes superconducting. However, in the cuprates, and especially in the underdoped cuprates (less oxygen doping than the optimally-doped), a gap opens up well above the Tc. The material doesn't become superconducting yet even as you lower the temperature even more. It is only when the temperature gets to Tc will the material becomes superconducting.
The origin of this pseudogap has long been debated. The posts that I had made discussed all this. However, in this new paper published in Nature (the article I linked too erroneously wrote "Science" at the time of this citation), the Z-X Shen group out of Stanford has detected the signature of Tc in the pseudogap region from ARPES measurement. But what is interesting here is that it was detected in the overdoped cuprate Bi2212.
Typically, the overdoped regime of the cuprates does not exhibit clear pseudogap signatures. When I studied a highly-overdopped Bi2212 using ARPES a long time ago, we did not detect any pseudogap at all since we saw the opening of the gap only at the bulk Tc value. Of course, this does not mean it wasn't there because it depends on the temperature resolution of our experiment. So it is rather interesting that this study decided to focus on the overdoped region where the pseudogap is more difficult to detect, as opposed to the optimally-doped or underdoped region where the pseudogap is much more obvious.
In any case, they apparently saw spectroscopic signatures of Tc within the pseudogap as the material cools down through Tc. According to them, this seems to be a strong evidence in support of a phase fluctuation (spin fluctuation?) model as the driving mechanism for superconductivity in these materials.
I tell ya, almost 40 years since its discovery, the cuprates continue to amaze and surprise us!
Zz.
You would think that once the cosmic microwave background (CMB) has been discovered and studied, that was the end of it. That is not how science typically works, especially on something that has such a rich amount of information as the CMB.
This article reports on the next proposed major research effort in the US in further studying the CMB and refining the measurements that we currently have. The article gives you a good over view of what we currently know about the CMB, what we wish to extract out of it, and how it can be done. This appears to be a joint effort between two major science funding agencies in the US: the US Dept. of Energy and the US National Science Foundation, and will have an estimated cost of $650 million.
As someone who likes to include contemporary and most recent relevant news into my lessons, this will be another item that I will include in my Intro to Astronomy class.
Z.
Previous posts:
My favorite web applications - Part 1
My favorite web applications - Part 2
My favorite web applications - Part 3
Of course, I have to include a PhET application. How could I not? It is such an amazing collection of very useful applications and simulations.
For this one it is the demonstration on Faraday's/Lenz's law. What is interesting about this is that, if you have read one of my previous posts, I use this not so much as a virtual lab, but rather as an in-class "discovery" tool. In fact, for my f2f classes, I had an identical setup to this PhET application sitting in front of the students at the beginning of class. So the instruction that you'll see given to the students is almost identical for this application and for in-class activity.
This obviously is a lesson on Lenz's law. Instead of starting the lesson with a lecture, I give the students a series of tasks for them to do. I first tell them to set up the application or in-class apparatus to look like the picture below:


We then spend some time discussing the direction of the current in the coil if the galvanometer (in-person) or the voltmeter (PhET) has a positive or negative deflection based on being observed from the right side of the coil.
Once the students have established this, I give them a series of tasks that they have to perform and to record what they observe. The tasks are listed in the table below:

When we were doing this in-person, I asked the students to perform Task 1, to record what they observed, and then we all, as a class, discuss the observation. This exercise was helpful especially to students who were still unsure on what to do and what they should be observing. So this first tasks often clarified further what they needed to perform and what they should observe. For remote classes, this is not that easy mainly because I don't quite see what they students are doing and what they are observing. They are also doing this in their separate Zoom breakout rooms. They have a chance to discuss with members of their group, but I am not always there to double-check what they are observing. I do, however, get to see what they are recording because the table above is posted on a Google Slide document that I give them. So I can see every entry for each group and able to step in if I see something not quite right.
In any case, the students for in-person session perform the task one step at a time, and each time, we all discuss the observation. Remember that I have not told them anything about Lenz's law at all. All they are doing at this stage is performing a task and recording the corresponding observation.
By the end of this activity, both the in-person and remote students will have a set of observations for each of the tasks performed. This is where it gets interesting. I then instruct the students to discuss with their group members on how to come up with a set of rules or "laws" to accurately describe the behavior of the current in the coil in relation to what the bar magnet is doing. In other words, I want the to come up with a written description of Lenz's law.
Of course, I give them hints. The biggest hint is for them to consider the induced magnetic field in the coil. By that point, they have learned that a current in a coil or solenoid generates a magnetic field. If there is a deflection in the galvanometer/voltmeter, then there must be a current in the coil. The positive or negative deflection indicates the direction of the current in the coil, which in turn indicates the direction of the induced magnetic field in the coil.
From my experience in doing this for several semesters, only about 1/4 of the students were able to come up with a description that had a close resemblance to Lenz's law. Many of them struggled not just in understanding what they observed and what the "laws" were, but also in communicating accurately and clearly what they intended to say. The latter is a very common problem for many students trying to write scientific prose.
However, regardless of whether they managed to successfully come up with their own version of Lenz's law, I find that this exercise demonstrates this principle a lot clearer than if I just simply spew out the material in a lecture. Even if the students could not communicate clearly what they understood, most of them actually had some realization of what it is. To me, this is the biggest stumbling block in understanding Lenz's law, which was the impetus for me to present this topic in this manner.
The PhET application allowed me to do almost the same activity online as the one I do in-person. That is a very good thing!
Zz.
Previous posts:
My favorite web applications - Part 1
My favorite web applications - Part 2
Continuing with this series, here is my next favorite web application. This is a virtual experiment on measuring the specific heat of an object. The fun thing about this particular application is that (i) it is very similar to what we normally do in a real experiment and (ii) one can also use the step-by-step instruction as part of the experimental procedure, thus the name "Guided Specific Heat.... ".
Similar to the force table experiment that I cited in Part 2, this one also has randomized values for each person going through it. It randomizes the mass of the cold water, the mass of the object, and uses different specific heats. Each student doing this online will have a different answer.
When I assigned this to the students during our remote sessions, the students had to fill in all the information obtained during each step, i.e. measurement of the mass, etc. Then, during the actual measurement, once it stopped, the students had to do a screen capture of the graph of Temp. vs. time to paste in their report. They then had to show their work on how they arrived at the specific heat value of the object. If they entered the correct answer, the application acknowledges that and they should also do a screen capture of that to paste in the report. If they got it wrong, then they had the option of either submitting what they had and take the deduction for the wrong work and answer, or redo the experiment from the very beginning. They get to do this as many times as they wish until they get it right.
I also added an extra part where I asked them to think of the kind of errors and uncertainty in the experiment, especially if this were done in real life.
To double-check the students' answers, I created a spreadsheet where all I needed to do was to enter the mass of the object, mass of the cold water, and the final temperature.
I like that each student will have a different answer. It added an extra layer where they could not just copy off each other's work directly. The experimental procedure is also almost identical to one of our experiments on specific heats anyway, so I didn't have to make huge modification to the instruction.
Now that we have gone back to f2f classes, I'm using this exercise as part of a homework assignment.
Zz.
So I'm reading this article in Physics Today of a study done on citation numbers and frequency of citation of papers where the first and/or last author is a woman. They found that papers authored by women tend to get less number of citations than men.
The number of papers authored by women in the eight physics subfields examined in the study almost doubled between 1995 and 2020, from around 17% to roughly 33%, as shown in the graph above. But those manuscripts attracted about 3% fewer citations than expected, whereas those whose first and last authors were men were cited roughly 1% more.
What’s more, the gender gap was largest in papers authored by men. According to the study, manuscripts with male authors cited recent male-authored papers about 2% more than expected and cited recent papers authored by women 6% less. Studies with a female author over-cited recent female-authored papers by 3% and under-cited recent papers by men by 1%.
Hum... But then they also say this:
One limitation of the study is that it couldn’t decipher the gender of about one-fifth of the authors, those who list only their initials instead of their first names, Bassett notes. Although Bassett says she and her team excluded those authors from their sample, McCullough thinks a significant number of them could be women. She says women in science often hide their first names to avoid discrimination.
Another problem, Bassett says, is that the software determines the chance of an author being a certain gender on the basis of his or her name, but it will be wrong at least some of the time, especially for gender-neutral names. It also cannot identify nonbinary individuals.
As someone who has read, and continues to read a lot of physics papers, the LAST thing I pay even any attention to is the gender of the authors. In fact, it is a common practice (and certainly in the groups that I have worked with) that when we publish a paper, we tend to only include first-name initials in the authors list rather than full name. It is also from my personal experiences that many of the papers that I have cited turned out to have women as first authors. No one could tell just by looking at the authors list that "K. A. Moler", "N. Trivedi", and "K. Levin" are women, for example.
Coupled with the fact that they found 3% fewer citation for women and that their study had to exclude about 20% of the authors because they couldn't tell their genders, this observation is not very convincing to me.
Zz.
It's interesting how something things come in clumps. I had just posted a paper on the effect of sharing tasks during lab work on student's interest and self-efficacy in physics. Now comes a study on gender differences in test anxiety and self-efficacy in general physics courses.
Now, to be clear, a large part of this paper clearly indicates that this is not something that physics educator can solve. This is because the issue of self-efficacy starts when a student is very young, and it has more to do with societal and cultural influences.
Performance differences between male and female students in physics courses are often due to sociocultural stereotypes and biases pertaining to who belongs in physics and who can excel in it, and insufficient efforts to counter them in order to make the learning environment more equitable and inclusive. For example, girls are less likely than boys to have parents who believe they can excel in the sciences so parents are less likely to encourage them to pursue related courses and activities from early on [5, 31]. This, combined with societal stereotypes that success in physics requires particular brilliance and brilliance is associated with men, in part explains the low numbers of women in the field [32]. Women are less likely than men to take physics in high school [10], so they are less likely to have prior experience if they are required to take physics in college. Once women are enrolled in physics courses, they tend to have lower SE, which is an important predictor of physics performance, even when controlling for prior academic preparation [19–21, 23, 24].
So already from this, this issue of test anxiety and self-efficacy among girls can't simply be swept away. Instead, this paper proposes how to handle such a thing by emphasizing more on assessment that are low-stakes (i.e. less stressful) and less on higher states assessments, such as exams.
This is definitely something to think about. It is already something that I am doing after we went remote when I consider how easily exams can be compromised. I shifted more emphasis on synchronous and asynchronous engagements that can assess a student's understanding of the material. In fact, in one of my general physics courses that ran synchronously, the total percentage of all the exams for the semester came up to less than 50% of the course grade.
Of course, I was doing this not for the reasons emphasized in this paper. I was unaware of such an effect until I came across this paper a week ago.
Zz.
This is a rather eye-opening paper on the impact of how students work together during lab work. It seems that when students divide specific tasks among themselves, there is less equitable benefits in terms of physics interest and self-efficacy. This is in comparison to the group of students (Group B) who tend to share the same tasks or take turns in doing different tasks during the experiment.
In particular, we find that Group B-style work is especially beneficial for women, a group that has historically been marginalized in physics. Thus, improving the equity of group work may be a productive step in efforts to improve equity in our field. In this context, we view equitable learning as providing equitable access to physics classes, inclusive learning environments that meet the needs of all students equitably, and learning outcomes that are not biased toward or against any groups of students. In order to improve equitable learning, we encourage educators to find ways to structure student learning to support Group B-style collaborative learning experiences for students.
Of course, this is easier said than done. The tendency here is to let the students themselves decide how they will work together. This means that if we want the students to adopt the working style of Group B, the instructor and the course structure itself has to coerce the students into it. The paper offers several suggestions on how to do this, which you may read in the paper.
This is something that I need to think about more carefully. Is there a compelling enough of evidence to support such an assertion? And if there is, have there been verified and tested methodology that accomplished the stated goals? I sometime feel that, as educators, we are being inundated with a "flavor of the month" of what we need to do for the students in the name of inclusion, equality, equity, accessibility, etc..... etc, and how to execute all that remotely even!
Still, as someone who emphasizes on experimental work quite a bit (being an experimentalist myself), I will need to read this paper a bit more and see if there are any of the recommendations that I can easily do without much modification to the current structure. I know that I have always try to limit the number of students in a group (typically 2 students per group if we have sufficient equipment), so that no one ends up just sitting there and doing nothing but watching and writing down numbers. But this paper may force me to figure out some ways to encourage each student to take turns to perform the experiment and experience every part of the work.
Something to think about, I suppose...
Zz.
Previous posts:
My favorite web applications - Part 1
It is rather appropriate that the next web application on my list can actually make full use of the vector calculator that I mentioned in a recent post. Many of you may be familiar with the force table in a General Physics course lab. It is a contraption that looks similar to the picture below.
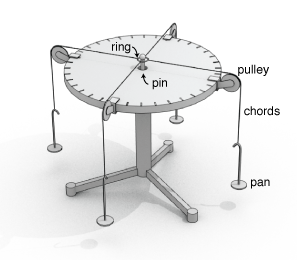
It actually is a rather useful apparatus to demonstrate vector addition and the powerful and convenient method of vector addition using components. Of course, when I assigned this to my students, we didn't use any vector calculator. The students had to calculate the components and find the resultant vector themselves. But this was also the situation where the students encountered the issue with knowing the correct angle that I mention in the vector calculator post. The only difference being that the visual "obviousness" here is more apparent than just looking at the numbers on an Excel spreadsheet.
When we went remote, I was lucky enough to come across this website that had a virtual version of the force table. In fact, other than not having the students struggle with knowing what weights to use, where to clamp them, and how to set up the pulleys, this exercise is quite similar to what I would normally do in class. I had to do only minor rewrite to my lab instruction to incorporate this web exercise.
The one thing I like about this app is that the situation is different for each student, i.e. the magnitudes and directions are unique to each student. Therefore, while they can consult with each other, each student still has to do his/her own calculations to get the answer. The students are given the instruction that they need to do this until they get it right, even if they exhausted all the tries and have to get the web to regenerate brand new set of forces and angles. Once they get it right, they have to do a screen capture of the acknowledgement page, and paste that in the report along with the working done to arrive at the correct answer.
The only thing I wish this web app has is the ability to specify the number of weights (or vectors) in use. In my in-person lab, I had the students start with just one vector, and they have to construct an opposing vector to get the equilibrium condition (trivial, of course, but you'd be surprised at the number of students who had to think about how to do this). Then they move on to having 2 given vectors, and finally 3 vectors, which is what we have in the web app. By doing this gradually, the students realize that they first need to find the resultant vector, and once they have that, all they need to do to get the equilibrium condition is to create another vector of equal magnitude but in opposite direction to the resultant.
Nevertheless, this is a useful web app and something that I intend to use even for in-person instruction.
Zz.
First of all, I'm not sure why this is called "Quantum sensor". Maybe it is because it is using solid-state physics principles?
This is an interesting report, and if the simulation is valid, I'm hoping that such devices will be made real soon because it has the ability to detect other types of viruses. It really is a solid state sensor that makes use of solid state physics principles.
In the presence of viral RNA, these pairs will detach from the nanodiamond surface thanks to a process called c-DNA and virus RNA hybridization. The newly formed c-DNA-Gd3+/RNA compound will then freely diffuse in solution, thereby increasing the distance between the magnetic Gd and the nanodiamond. As a result of this increased distance, the NV centres will sense less magnetic “noise” and thus have a longer T1 time, which manifests itself in a larger fluorescence intensity.
By optically monitoring the change in relaxation time using a laser-based sensor, the researchers say they could identify the presence of viral RNA in a sample and even quantify the number of RNA molecules. Indeed, according to their simulations, Cappellaro, Kohandel and colleagues, who report their work in Nano Letters, say that their technique could detect as few as a few hundred strands of viral RNA and boast an FNR of less than 1%, which is much lower than RT-PCR even without the RNA amplification step. The device could also be scaled up so that it could measure many samples at once and could detect RNA viruses other than SARS-CoV-2, they add.
I find this interesting because as students in solid-state physics, one of the first thing that the students encounter in such a course is the study of solid-state crystal lattice. This includes the type of defects in a crystal lattice, such as vacancies and impurities. So this diamond NV center is exactly those two types of defect in the lattice. Imagine that something you learned during the first couple of weeks of a course in school actually has a humongous application to human well-being!
Chalk this one up as another invaluable application from condensed matter physics.
Zz.
I was asked to show this video to students on how to set up their own vector calculator using Excel. The calculator gives you the ability to find the sum of vectors just by entering each vector's magnitude and direction.
Is it useful? Sure it is, but this is where if you don't know what is going on, you may be using it incorrectly! I have a couple of examples to show that.
After you have set up the calculator using the example shown in the video, enter these:
Vector A: Mag=9.8; Ref. Angle=114
Vector B: Mag=16.5; Ref. Angle= -104
Vector C: Mag=11; Ref. Angle=180
If you have set up the calculator correctly, you will get the resultant vector having a magnitude of 20.2 and a direction of 20.4 degrees.
If you don't know any better and I ask you to sketch out the direction of this vector, you would have drawn an arrow that is pointing in the first quadrant of a Cartesian coordinate system, which would be WRONG! In fact, most of my students would do that. It is a natural and automatic tendency to do so since angles are measured counter clockwise relative to the positive x-axis.
If you do a quick sketch and do a "tip-to-tail" vector addition, you will end up with a vector that is actually pointing in the 3rd quadrant! In fact, the true angular direction for this vector is 200.4 degrees (180 + 20.4, the latter is the angle found from the calculator).
The reason for this is that in calculating the angle, one is dividing the y-component by the x-component. This vector has both components being negative and so the division produces a positive value, producing a positive angle. But this angle given by the calculator, if one were to sketch out the vector, is the angle measured from the NEGATIVE x-axis, not the standard positive x-axis. If one remembers lessons from trigonometry, it is why the value of the tangent of an angle is positive in both the 1st and 3rd quadrant.
So the angle given is "correct" if one knows where it is measured from.
Here's another example to try:
Vector A: Mag=12.7; Ref. Angle=45
Vector B: Mag=19.2; Ref. Angle= -171
Entering this into the calculator, you get the resultant vector having a magnitude of 11.7 and angular direction of -30.9 degrees.
Once again, if you simply go by what you get, the tendency here is to think that the vector is in the 4th quadrant, because a negative angle means that it is an angle measured from the positive x-axis but going clockwise.
This is wrong.
The vector is actually in the 2nd quadrant. A simple sketch to do the vector addition will confirm that. The angle "-30.9 degrees" is actually an angle measured clockwise from the NEGATIVE x-axis. For this vector, the x-component of the resultant is negative, and thus, the ratio of the y-component to the x-component is negative, resulting in a negative value of the tangent and the angle. Once again, from trigonometric lesson, the tangent of an angle is negative in the 2nd and 4th quadrant.
What this all means is that a positive angle value is not unique - the vector could be in the 1st or 3rd quadrant - while a negative angle value is also not unique - the vector could be in the 2nd of 4th quadrant. Either do a quick sketch to do vector addition, or look at the sign of the resulting components.
There are two important lessons here. First is that one must know what the numbers mean. Using them blindly without understanding how they come about is risky and may result in the wrong conclusion. Secondly, for this exercise, there is no substitute for doing a sketch and knowing how vectors add. A simple sketch will provide an important sanity check that your conclusion about the vector direction is not wrong.
While this video and the setting up of the calculator is useful, the producer did not go far enough to demonstrate the possible pitfalls in using it blindly. There should have been examples involving what I had presented to tell the viewers what they should be careful about. I just wonder how many people had used this and interpreted their results incorrectly.
Zz.
Remember way back when the LHC was about to start up and a couple of nutcases decided to file a lawsuit in the US to stop it? If you missed the fun, read a couple of my earlier posts here and here, and the dismissal of the lawsuit here.
So now that the LHC has run for many years, had gone through an upgrade, and will probably continue to do so for the next few years, what do these wackos have to say for themselves? I know that going back and asking them will probably be fruitless because we are giving them more airtime than they deserve, but I'm always curious to see how someone like this react to the clear demonstration of how wrong he is.
But then again, if something like the Jan 6th insurrection can be called a "legitimate political discourse" despite the most obvious evidence, then there's no convincing some people of how wrong they are.
Zz.
I've used online web applications as supplement or enhancement to the class material, but during the pandemic when we went remote, I relied on them even more. In fact, I remember a couple of days where I did a lot of surfing and searching to find suitable web applications for various activities and topics, simply to catalog on the various things that are out there that I could use for my classes.
Over the months and years, I have a bunch of web applications that I consistently go to that I find to be quite useful. These can either be simulations to illustrate a physical concept, or virtual activities or experiments that mimic what students may perform in a lab.
In a series of posts, I will show what I've used and how each one was used, especially during a remote class. Maybe someone might find one or more of them useful, or might see it being used in a different way. Better yet, maybe someone has a better web application for the same task. I definitely like to hear that!
To start of, here is my most favorite web application to demonstrate the phases of the moon and why we, on Earth, see what we see. Despite the simple-looking screen, this webpage is choke-full of information. The biggest part of the screen shows the location of an observer on Earth, the location of the Moon, and the position of the Sun. You can manually click and drag the observer and the moon to get them to move to any valid position, or run the animation.
But don't ignore the two smaller animation on the right side of the screen. The top animation shows the moon phase that the observer sees at that time of the month. The lower animation shows what the observer sees at that time of the month and the time of the day. It indicates the positions of the moon and the sun at that particular time of day.
This is a very useful application to get students to understand why we see various phases of the moon, why we see the moon in a particular position in the sky at certain time of the month, etc. I tend to let the student play with the application for a while and then ask them to use the application to answer a series of questions. For example, what is the most likely day of the month for you see a full moon directly above your head at midnight? This is what the student should set up with the application to answer this question.


One of the best thing about this app is the ability to make the students realize, if they haven't already, that they should and can see the Moon during the day, i.e. when the Sun is also in the same side of the sky as the Moon! This allows use to discuss the often-mistaken idea that the phases of the Moon are due to the shadow of the Earth on the Moon from the Sun. We can also carry a more advanced discussion on why we don't see eclipses of the Sun and the Moon every month, especially if they have understood what this web application seems to convey.
I've looked at other websites demonstrating and explaining phases of the Moon, but to me, this is the best one out there so far.
Zz.
When classes had to go remote or online due to the pandemic, the biggest issue for general physics courses was, among other things, the labs. These courses were not designed to be done remotely, and so the labs could not simply be adopted for remote learning. This is in contrast to online general physics courses that were designed to be done remotely and have lab kits designed for such courses.
I had to resort to using virtual web applications and simulations at first, making extensive use of the PhET website, until I discovered Pivot Interactives. But this is not about that. Rather, I also had to think a little bit of actual activities that a student could do using simple, household stuff, that can either be their "experiment", or a supplement to any simulation or online labs that they did.
When we started a topic on electric charges, I used this as an in-class activity to supplement the lecture as a demonstration of static charges. When we went remote, I changed it so that it became an experiment that the students could do at home because it uses only one thing: sticky cellophane (Scotch) tape. I'm sure this is familiar to many people, but I'll describe briefly what is involved.

You take 4 strips of sticky tape, each about 6 inches long. Fold under one end of each tape so that that end doesn't stick to anything and acts as a convenient handle.
Take one tape and stick it to a flat surface such as a table or desk. Mark one end of it with a "B1" for bottom tape 1. Take another tape and stick it on top of B1. Mark that tape as "T1" for top tape 1.
Do the same for the other two tapes, but mark them as "B2" and "T2" for bottom and top tape 2, respectively. You should end up with something similar to the picture above.
Now take T1 and rip it off B1. Stick the sticky, unfolded end of T1 to the edge of the table so that most of the tape hangs freely.
Pull tape B1 off the table. Hold B1 at the folded end and let it hang down freely. Slowly, move it closer to tape T1 but don't let them touch. What do you see?
Next, attach the sticky, unfolded end of B1 to the edge of the table, very much like what was done to T1.
Rip tape T2 off B2.
Hold T2 at the folded end and let it hang down freely. Once again, slowly move it closer to T1 and observe. Repeat this by moving T2 closer to B1 and observe.
Attach T2 to the edge of the table again, the same as what you did with T1 and B1.
Pull tape B2 off the table, and repeat the process with T1, B1, and T2.
So that is the entire "experiment". The students had to describe clearly what they observed. I emphasized that this part should be just observational. I was not looking for explanation yet. The aim here is to distinguish between observations, which if valid are "facts", versus explanation which can be interpretation based on our understanding.
If the experiment was done carefully, the observation should be like this:
Those are the observations. So the next part is the explanation for the observation. Here, we invoke our understanding of the nature of forces on charges. We know that like charges repel, and unlike charges attract.
Since the two T tapes repel each other, we can conclude that they have the same type of charge. Similarly, since the two B tapes repel each other, we conclude that they have the same type of charge. Next, since the T tapes seem to attract the B tapes, then they have opposite charges. Thus, what we have in terms of the type of charge is
T1 = T2
B1 = B2
T1,T2 have opposite charge to B1,B2.
Now, if given NOTHING ELSE, this is as much as you can say about what you can get out of the experiment. But somehow, every single time I've had students do this, a few of them inevitably went a step further (or maybe a step too far?) and managed to conclude that tapes T1 and T2 have a particular type of charge (say, negative), which means that B1 and B2 tapes have positive charge. I don't quite know how they arrived at this conclusion.
Rather than just telling them that they were "wrong" in the sense that they could not deduce the nature of the charge just from the experiment alone, I decided to use this as a class discussion topic. My main question was that, to what extent can you squeeze all the information out of an experiment based on the observation, and when have you gone a bit too far?
Nothing in the observation alone tells you the type of charge on each tape. What you do get is the relative type of charge when you compare one tape against another. You can't tell which one is positive and which one is negative simply from the observation. You can only tell if two tapes have the same or opposite charges. That's it. That is the limit of the valid and verifiable conclusion that you can draw out of the observation. The experiment tells you nothing about the type of charge that each tape has.
I then asked the students if they can suggest what we can do next to actually determine the type of charge on each tape. Certainly, if we have a "reference" charge, something that we know that has a particular type of charge, then this can certainly be used to determine the type of charge. For example, rubbing wool onto a glass rod has been shown to induce a net positive charge on the rod. So the rod could be used as a reference. But I asked the students whether it is necessary to use this reference charge on ALL of the tapes, i.e. check what happens if they bring this reference charge to each individual tape. The purpose here is to use the inductive deduction, where one only needs to check with just one tape, and knowing that tape's relationship with the others, automatically determines the type of charge on all of them.
But the key thing here is that the experiment by itself can only tell you information about what is going on up to a point. Making a deduction that goes beyond that means that you are either guessing or speculating. While that is fine if you realize that that is what you are doing (we often do that in science research), it should not be confused as facts given by the experiment. They are not. The ability to know the type of charge on each tape requires a reference. Consequently, the validity of our determination of the type of charge on each tape depends on the validity of our knowledge about the reference charge. If, for some reason, our understanding of the reference charge is wrong, then our conclusion about the type of charge on each tape will also be wrong, BUT, our observations are not! The observations are facts, and they remain valid even if we wrongly assigned the type of charge on each tape.
This very simple exercise, and the lessons that can be learned from it, have huge implications to our world today. This is because a lot of people have a lot of problems deciphering and distinguishing between valid facts and conclusions/speculations. Often times, those two are intermingled until one can no longer tell which is which. I've seen people arguing about the conclusions, and somehow, that undermines the validity of the facts that they were based on, very much like wagging the dog. Even worse, when the "facts" are shown to be flawed or discredited, somehow the conclusions that were based on those facts remained alive and well!!
As science educators, we need to make a conscious effort to impress upon the students that science education is not just about learning the science. It is also learning how to think and the process of making systematic and rational deduction based on the nature of the facts.
Zz.
First of all, a clarification for those who are not aware of this. The term "accessible" as used here in the US within this context tends to refer to accessible to people with disabilities.
This is a report or maybe a White paper by a committee given the charge by the American Association of Physics Teachers (AAPT) to study how we can make physics labs in schools more accessible to students with various types of disabilities. I have read through it rather quickly, and I intend to read it some more when I have the chance (I've only stumbled upon it today).
Let me just say that for most physics college instructors, especially in Ph.D-granting institutions, there is very little training and awareness of the issue of accessibility of the physics courses that are taught, much less the consideration of making physics labs accessible to people with various types of disabilities. I myself was ignorant of such things until I decided to be trained as an online instructor during the COVID shutdown. It was during such training that the idea of accessibility and designing a Learning Management System (LMS) page and course material that are accessible came into my conscious awareness. So now, almost everything I post to the course's LMS page, and almost all the online material that I distribute tend to pass an accessibility evaluation, even when none of my students needed them to be.
However, those are the only things I'm capable of doing. I still struggle in trying to figure out how to make some of the more complicated figures, graphs, etc. to have the accurate alt-text to accompany them. I still am not sure how these document readers translate mathematical equations, and whether this is done accurately. And of course, the issue of how to make lab accessible to a student who can't see, can't hear, can't lift or grab something, can't walk, etc. goes way beyond my pay grade! This is not something that is easy to solve and most likely require department-wide or even institution-wide support and involvement. It will also involve quite a sizeable funding if we have to retrofit and install devices, software, etc. to existing physics lab equipment.
I'm not going to lie, I find this goal to be an exceedingly difficult task to accomplish. As an experimentalist by training, my philosophy for lab work is not just about the data-collection, but also the act of physical assembly of the equipment, following and understanding the instruction, problem-solving and making diagnostics when things don't seem to work as they should, and being creative at figuring out what causes what. I don't know how to accomplish all of this and still make the physics lab accessible to all students regardless of the type of disabilities that they have. The gist from the document that I referred to only gave superficial ideas and recommendations.
Maybe this is the lighting of the fire to start the pot to boil. I hope it is because I see a huge amount of problem-solving work to make the general physics lab more accessible and still manage to hit all the student learning goals.
Zz.
A while ago, I read this article on battling those who believe that the Earth is flat but forgot to highlight it here. I won't say much more about it other than have you read it for yourself.
But one quote stood out with me, because it sums up not just the way it describes why flat-earthers believe in what they believe in, but also a reflection on the issues of vaccines, face masks, etc. that we have been facing with during this pandemic and these fake-news stupidity. The quote is attributed to Lee McIntyre of Boston University:
Flat-Earthers seem to have a very low standard of evidence for what they want to believe but an impossibly high standard of evidence for what they don’t want to believe.
Replace "Flat-Earthers" in the quote above with any of the conspiracy theory believers and you have the gist of why they believe in the crackpottery.
But the question that I have is, has anyone ever mention THIS to the flat-earthers themselves? Are they self-aware that this is what they are doing?
Zz.
This news report on The Telegraph written by Joe Pinkstone about the James Webb Space Telescope reaching its final position has a basic flaw that should be easily spotted by any intro physics student who has understood basic central force/circular motion topic.
It will stay at its current position, Lagrange 2 (L2), for its entire operational lifespan, which is expected to be around 20 years. L2 is a gravitational stable point on the other side of the Earth from the Sun, where the pull of the two bodies cancels out.
No, the pull due to the Earth and the Sun does NOT "cancels out", because if it does, then there is no centripetal force to keep the telescope to orbit around the sun!
Rather, this is the location where the sum of the gravitational forces from the Sun and the Earth provides just the right centripetal force to keep the telescope in orbit around the Sun at the same angular speed as the Earth. It will always be on the opposite side from the Sun with respect to the Earth. You can read more explanation on what is this Lagrange2 (L2) point at the NASA website here.
This is the type of mistake that we expect to see in General Physics classes, not in major news media.
Zz.
This is not a critique of the winning photo. Rather, it is an example of a "click bait", where the news report tries to entice you to read it because the title is so astounding. I guess it worked on me.
This news report, purportedly from Popular Mechanics, is highlighting a winning science/engineering photo of a single strontium atom being held in an ion trap. But what it says is a bit misleading:
Now, we have a photograph that shows a single atom floating in an electric field, and it's large enough to see without any kind of microscope.
This is wrong. It is not "large enough" to be seen.
They corrected this somehow later in the article, but it still does not dispel the error that this has nothing to do with size, and it requires a bit of elementary knowledge of atomic energy level to realize that the earlier description is a mistake.
The strontium atom in the photo is hit by a high-powered laser, which causes the electrons orbiting the strontium atom to become more energized. Occasionally, these energized electrons will give off light. With enough energized electrons giving off enough light, it's possible for an ordinary camera to image the atom.
In other words, the strontium atom was excited and this then causes it to emit light. This process is no different than the light that you see from neon signs or your fluorescent light bulb that has mercury vapor. The unique part about this setup is that you are seeing light from a single atom, whereas in your neon signs, you are seeing the light from many, many atoms. But the process is identical! Yet, we don't go ga-ga and proclaim that we can see an atom with our naked eye.
Just be clear, you are not seeing the atom in the normal sense. You are seeing the light from an atomic transition of this strontium atom. The fact that this is made by a captured single atom is remarkable. The fact that we can detect light from this atom with our "naked eye" does not mean that we are "seeing" the atom in the normal sense that most people understand it.
Zz.