Showing posts with label Experiment. Show all posts

Sunday, July 26, 2026

Are Quasiparticles Real?

I'm posting this because someone here (@dougnatelson) can respond to this. This is based on this article that asks if quasiparticle are real.

In much the same way, "quasiparticles can only exist within some medium or material, because they are built up from the response of that material's constituents or building blocks," Natelson said; in contrast, particles such as electrons and protons "can exist in free space."

In other words, quasiparticles can't exist in a vacuum and they can't exist on their own. They're reliant on particles acting together and being in a material where they can emerge, just as a wave carried out in a stadium can only exist when there is a group of people there who can perform it.

As a condensed matter physicist, I'm quite familiar with the concept of "quasiparticles", since we deal with electrons, "holes", etc. that undergo many-body interactions. It is why, for example, charge carriers in solids have "effective mass", which is typically not the "bare mass" of the charge carrier, but the "normalized" mass due to such many-body interactions. In essence, we have reduced one many-body problem into many one-body problem by lumping the complicated many-body interactions into this new particle's mass. This particle is often called the "quasiparticle".

But the above is a highly simplified picture. Some people would say that this is the Fermi Liquid model of quasiparticles where the strength of the coupling between the particle and the many-body interactions are "weak", allowing for such simplification. This is no longer true for particles with strong interactions where the Fermi Liquid model breaks down (marginal Fermi Liquid and so on). Therefore, it can get very complicated, especially when you add particles in reduced dimensions (2D and 1D).

I like this article because it highlights a very basic concept in condensed matter physics that does not get the appropriate publicity. However, the one issue that is missing is the explanation on what we mean by "real". Is an electron "real" based on what we measured the "bare electron" properties? After all, if we buy into the idea of quantum field theory, even a bare electron has its own vacuum interactions. This leads to the crazy idea that particles actually are all the result of some kind of many-body interactions themselves, i.e. they are quasiparticles!

Instead of worrying whether something is "real", whatever that means, we should be focusing on fact that we can measure such-and-such properties of such-and-such a thing. The measurements, or rather, the outcome of the measurements are real for they can be reproduced. The measurements represent the characteristics and properties of the entity that we are measuring. Maybe this is carrying empiricism to the extreme, but it beats trying to convince people that it is "real".

😊

Zz. 


Wednesday, March 25, 2026

Entanglement and Experiment

The AIP has produced one of the most informative historical account of the history of quantum entanglement after EPR, especially on its development before Bell came up with his infamous inequality test. It is a two-parter, so you definitely want to read both.

Entanglement and experiment, part 1: Before Bell

Entanglement and experiment, part 2: Oral history of the first Bell tests

What I was not aware of was the early experiment by Chien-Shiung Wu in this area. She is definitely one of the giants of physics that should have been awarded the Nobel Prize. I'm glad this article finally gives her the recognition that she deserves, and it certainly gives me even more reason to admire her accomplishments.

Zz. 

Wednesday, October 08, 2025

2025 Nobel Prize in Physics

It's unusual that a Nobel Prize in Physics is given to physicists working in the field that was the same as my PhD research work. It finally happened this year.

I did research work in tunneling spectroscopy in cuprate superconductors, and we did both superconductor-insulator-normal metal and superconductor-insulator-superconductor tunnel junctions, the latter of which is where we observe the Josephson tunneling current. Therefore, the work cited here is something that I'm quite familiar with. I just never realized till now that it was such a major discovery to be awarded a Nobel Prize. I know that one of my colleagues had John Clarke as his PhD advisor at Berkeley.

Interesting that this is such an old and well-established phenomenon and technique that is only now being recognized.

Zz. 

Tuesday, July 08, 2025

Another Sighting of a Possible Fifth Force?

First of all, I'm old! I started being in a student in physics since the early 1980's (do your own math). During all of that time when I have paid attention to physics, I've seen a lot of major milestones, including the discovery of High-Tc superconductors, discovery of exoplanets, the cold-fusion debacle, etc...etc.

The one thing that pops up every now and then is the claim of the possible discovery of this "fifth force". Honestly, even back in the 1980's, there were already such claims being made. None of the have amounted to anything as far as I can tell. Therefore, you can understand my "Oh no, this again?" reaction when I read the latest claim of the possible detection of the Yukawa particle as an indication of the existence of this fifth force (that article contains a link to the actual PRL paper that you can download).

This is not a knock on this work, heavens no. But the publicity surrounding this makes it sound as if this has not happened before. I guess it is not surprising that people have short memory, which is why mistakes are often repeated.

I'm going to wait a year and revisit this post and see if we have gone beyond first based on this discovery.

Zz. 

Thursday, March 09, 2023

Room-Temperature Superconductor?

Here we go again!

Big news with the new publication out of Nature this week. A report on an observation of room-temperature superconductivity on a sample that is under pressure at only 1 GPa. That pressure is exceedingly low considering that most of the other superconductors that that has a high transition temperatures tend to be under hundreds of GPa.

Superconductivity has been observed at 20 °C (294 K) in a nitrogen-doped lutetium hydride under a pressure of 1 GPa (10 kbar). The material was made and studied by Ranga Dias and colleagues at the University of Rochester in the US, who claim that the finding raises hopes that a material that superconducts at ambient conditions may soon be found.

Not only that, this thing changes color as pressure is increased, with it turning from blue to pink at the onset of superconductivity. I'm sure doing a reflectivity measurement such as UV-VIS to look at the phonon modes would be very interesting here. 

But as with anything here, this needs to be independently verified, meaning that another group must be able to replicate the recipe and observe the same thing, before this is widely accepted. We will just have to wait.

Z.

Friday, February 17, 2023

Blackholes The Source Of Dark Energy?

Can blackholes at the center of galaxies be the source of the dark energy that we have been detecting?

That seems to be the conclusion based on two recently published papers [1,2]. Both of these are open access papers, so the full papers are available to everyone.

You may read an explanation and review of the papers at the AAS news website. The implication here is that if this is true, then dark energy is not something exotic or new since it can already be explained with General Relativity.

Now, if only we can find those pesky dark matter.... if they exist.

Zz.

[1] D. Farrah et al., Astrophy. J. Lett., v.944, p.L31 (2023).

[2] D. Farrah et al., Astrophy. J., v.943, p.133 (2023).

Saturday, December 24, 2022

2022 Nobel Prize In Physics Lectures

If you are bored over the holidays, here's something to keep you occupied for 2 hours.


Zz.

Wednesday, December 14, 2022

We Have Ignition!

So the big news of the week, which was preceded by the rumors a few days before the official announcement, is the breakeven achievement in a fusion process at Lawrence Livermore's National Ignition Facility (NIF).

This is certainly a major breakthrough, and it is something that has achieved for the very first time ever in a controlled experiment (it happens all the time in our Sun and other stars). However, to me, this is more of a proof-of-principle experiment, meaning that it is a demonstration that it is possible, rather than to show that it is viable. It is certainly very, VERY far away from producing anything useful because harnessing this energy is an entirely different matter.

While you can read many sites reporting this, I kinda like the one that I read on CNET because there's a certainly level of sensibility aimed towards the general public. In particular, there is this definition of what is meant by "breakeven":

More specifically, scientists at NIF kickstarted a fusion reaction using about 2 megajoules of energy to power the lasers and were able to get about 3 megajoules out. Based on the definition of ignition used by NIF, the benchmark has been passed during this one short pulse. 

But that doesn't convey the whole thing, because this is what should also be mentioned:

"The calculation of energy gain only considers the energy that hit the target, and not the [very large] energy consumption that goes into supporting the infrastructure," said Patrick Burr, a nuclear engineer at the University of New South Wales.

What it means is that they only considered the energy of the laser hitting the target, and then finding the energy output from the ignition that subsequently resulted in fusion. Sure, that energy output is greater than the input energy of the laser, but this is not the total energy of the entire facility that created the laser. That facility would still not be self-sufficient to run just by using the output energy of the fusion it created, even assuming 100% efficiency.

This does not diminish the amazing achievement, considering that other facilities and techniques have not even reach this level. It is just that it needs to be tampered with a bit more realistic expectations so that we don't oversell ourselves to the public.

Zz.

Wednesday, November 30, 2022

How Fast is Gravity?

 Don Lincoln has produce another fun video on the speed of gravity.

SPOILER: It has the same speed as the speed of light!

But what is more interesting in this video is a brief description of LIGO and gravitational interferometry and how gravitational waves are detected.

Enjoy!

Zz.


Thursday, July 07, 2022

Electrons Behave Like A Fluid - Exhibit Vortices

This is a rather cool experiment.

They have a direct observation, for the first time, of electrons behaving like an ordinary fluid and exhibiting vortices  when going thorough a channel.[1]

In contrast, electrons flowing through tungsten ditelluride flowed through the channel and swirled into each side chamber, much as water would do when emptying into a bowl.

.

.

“That is a very striking thing, and it is the same physics as that in ordinary fluids, but happening with electrons on the nanoscale. That’s a clear signature of electrons being in a fluid-like regime.”

So far, "ordinary" electron flow behaves like a "Fermi liquid", which is not like ordinary fluid flow. To get electrons to behave this way, they had to make sure that the electrons do not bump into the crystal lattice (the bulk material), so this is not easy since normal-state electrons usually have such interaction (non-zero resistivity).

Just to be clear, this is not the first observation of electrons exhibiting vortex flow. This is a common observation when they are in a superconducting state, where vortices form around magnetic flux lines that penetrates Type II superconductors. But in that case, these electrons are in a superfluid, and what is flowing is the paired electrons (Cooper pairs).

In this experiment, these are individual electrons not in a superconducting state, so this truly is a river of electrons.

Z.

[1] A Aharon-Steinberg et al., Nature 607, 74 (2022).

Thursday, June 30, 2022

My Favorite Web Applications - Part 6

Previous posts:

My favorite web applications - Part 1

My favorite web applications - Part 2

My favorite web applications - Part 3

My favorite web applications - Part 4

My favorite web applications - Part 5

Continuing on with my pet project here, this next web application is actually another one of those that closely mimics an actual experiment. This time, it is on specific heat, and the goal here is to measure the specific heat of an unknown liquid. You do this by measuring the mass and temperature of the unknown liquid, and then mixing it with hot water of known mass and temperate. By finding the final equilibrium temperature, you then calculate the specific heat of the unknown liquid.

Like I said, this web experiment is done step by step just like a real experiment. In fact, you could use this as the lab instruction and get the students to follow each step of the experiment. But what I like the most is that each student will be given a different set of numbers to work with. The masses will be different, and so will the starting temperatures of the liquid, resulting in different final temperature as well. I don't remember if the specific heat of the unknown liquid is also different for different students. Please let me know if you've used this app or if you discover this later on.

I used this as one of my virtual labs when we went remote. But I continue to use this after we gone back to face-to-face classes as part of my in-class problem solving exercises. I've also given this as a take-home homework problem, and they have to show the final acknowledgement page that they got this correct if they want to receive credit for it. If the students have done the actual experiment itself, this web application will be quite familiar and they should have a good clue on how to correctly find the unknown specific heat.

Zz.

Friday, June 24, 2022

Share It, Don't Split It - Is It Working?

I'm teaching a physics course with labs over the summer. And if you've taught Summer courses, you know that they go very fast and furious, so I'm not sure if there's any chance for any evaluation on the effectiveness of anything.

I mentioned a study a while back that seems to imply that it is better for students, especially minorities and marginalized students, to share lab work and have equal access to every part of the experiment, rather than splitting responsibilities and have each students just do one part of it. I am still unsure of how effective it is or whether I can tell if it is working, but I've made sure that the students know that no one is to do just one part of the experiment, that everyone must take turns doing different parts of the experiment.

Much to my surprise, the students seem to be amicable about it. So far, I've seen everyone taking turns and rotating themselves to different tasks as they perform the experiment. Better yet, I've seen students helping and teaching other students on what they just learned about doing certain parts of the experiment or in performing the analysis of the data.

One direct result that I've seen so far is that everyone in the group knows how to work and setup the computer interface to connect to the various sensors, whereas in previous classes, I've noticed that the same students had the responsibility of setting up the sensors. Already, I can tell that the students are learning about conducting the whole experiment rather than only certain parts of it.

I did not plan on doing any form of assessment on how beneficial or effective this is, because I had not run any control study before. Besides, it is a summer session, and "rushing" is the most common theme for a physics summer class.

I don't know if this will boost the students' "self-efficacy" but from simply a superficial observation, I can see the benefit of requiring that the lab work be shared rather than split.

Zz.

Thursday, May 05, 2022

My Favorite Web Applications - Part 5

Previous posts:

My favorite web applications - Part 1

My favorite web applications - Part 2

My favorite web applications - Part 3

My favorite web applications - Part 4

This time, it is an experiment that mimics the fabled Archimedes experiment where he supposedly determined for the "king" whether the crown was made of pure gold or not. This web application basically allows a student to perform a similar virtual experiment to determine the density of the object being investigated.

There are two reasons why I like this app. The first reason is that if you change the default settings for the mass and the volume, you will given rather random values. This means that each student will have different values for the mass and volume, resulting in each student having a unique set of data and calculation.

The second reason why I like this "experiment" is that it actually is the same experiment that we would do in a f2f lab. We use PASCO's Capstone system, and one of the experiments that we do is practically identical to what is shown in this virtual experiment, where a student has connected a weight sensor to a hanging mass, and then he/she slowly lowers it into a beaker of liquid. The sensor sends a reading of the hanging weight value to a data collection system that plots the value of the weight in real time. As the weight is lowered into the liquid, the data being plotted looks almost exactly as what is shown in the virtual experiment in this app. The weight changes due to the buoyant force of the liquid.

The analysis of the experiment and the extraction of the value of the object's density are similar for both the f2f lab and this virtual lab. So in that sense, the student is not being deprived of much of the physics. There are, of course, more errors involved in the real experiment because often the object isn't hanging still, and the movement adds more noise to the data. The app doesn't allow the data to be extracted directly, so no curve fitting or calculation of average value can be made for a range of the data points, something the students in the f2f lab are asked to do to be able to determined the weight before and after immersion.

Still, it is an adequate virtual experiment, especially since each student will have to do his/her own analysis on a unique set of measurement. I actually have used this as part of an assessment where this app was part of an exam for a f2f class (before the pandemic). The student had already done the actual experiment, so they should be familiar with how to find the density of the object using this app since things should look rather familiar.

Zz.


Wednesday, April 06, 2022

Signature of Tc Inside the ARPES Pseudogap?

The physics of high-Tc superconductors (or the cuprate superconductors) continues to be elusive. After its first discovery in mid 1980's, a coherent and consistent theory on why this family of material becomes superconducting is still up for debate. There are candidate theories, but we do not have an accepted consensus as of yet.

One of the main reason for this is that this is such a rich and complex material, exhibiting so many different characteristics and puzzles. As a result, different versions of theories are competing to describe as many of the experimental results as possible. But the target is also moving. As our instrumentation improves, we are discovering new, more subtle, and more refined behavior of these material that we haven't seen before.

The existence of the so-called pseudogap in the cuprates is well-known. I've posted several articles on them. This is the gap in the single-particle spectral function that opens up well above the transition temperature Tc. In conventional superconductors, the formation of this gap coincides with Tc, below which the material becomes superconducting. However, in the cuprates, and especially in the underdoped cuprates (less oxygen doping than the optimally-doped), a gap opens up well above the Tc. The material doesn't become superconducting yet even as you lower the temperature even more. It is only when the temperature gets to Tc will the material becomes superconducting.

The origin of this pseudogap has long been debated. The posts that I had made discussed all this. However, in this new paper published in Nature (the article I linked too erroneously wrote "Science" at the time of this citation), the Z-X Shen group out of Stanford has detected the signature of Tc in the pseudogap region from ARPES measurement. But what is interesting here is that it was detected in the overdoped cuprate Bi2212.

Typically, the overdoped regime of the cuprates does not exhibit clear pseudogap signatures. When I studied a highly-overdopped Bi2212 using ARPES a long time ago, we did not detect any pseudogap at all since we saw the opening of the gap only at the bulk Tc value. Of course, this does not mean it wasn't there because it depends on the temperature resolution of our experiment. So it is rather interesting that this study decided to focus on the overdoped region where the pseudogap is more difficult to detect, as opposed to the optimally-doped or underdoped region where the pseudogap is much more obvious.

In any case, they apparently saw spectroscopic signatures of Tc within the pseudogap as the material cools down through Tc. According to them, this seems to be a strong evidence in support of a phase fluctuation (spin fluctuation?) model as the driving mechanism for superconductivity in these materials.

I tell ya, almost 40 years since its discovery, the cuprates continue to amaze and surprise us!

Zz.

Monday, April 04, 2022

The Future of CMB Exploration

You would think that once the cosmic microwave background (CMB) has been discovered and studied, that was the end of it. That is not how science typically works, especially on something that has such a rich amount of information as the CMB.

This article reports on the next proposed major research effort in the US in further studying the CMB and refining the measurements that we currently have. The article gives you a good over view of what we currently know about the CMB, what we wish to extract out of it, and how it can be done. This appears to be a joint effort between two major science funding agencies in the US: the US Dept. of Energy and the US National Science Foundation, and will have an estimated cost of $650 million.

As someone who likes to include contemporary and most recent relevant news into my lessons, this will be another item that I will include in my Intro to Astronomy class.

Z.

Monday, March 28, 2022

My Favorite Web Applications - Part 4

Previous posts:

My favorite web applications - Part 1

My favorite web applications - Part 2

My favorite web applications - Part 3

Of course, I have to include a PhET application. How could I not? It is such an amazing collection of very useful applications and simulations.

For this one it is the demonstration on Faraday's/Lenz's law. What is interesting about this is that, if you have read one of my previous posts, I use this not so much as a virtual lab, but rather as an in-class "discovery" tool. In fact, for my f2f classes, I had an identical setup to this PhET application sitting in front of the students at the beginning of class. So the instruction that you'll see given to the students is almost identical for this application and for in-class activity.

This obviously is a lesson on Lenz's law. Instead of starting the lesson with a lecture, I give the students a series of tasks for them to do. I first tell them to set up the application or in-class apparatus to look like the picture below:

We then spend some time discussing the direction of the current in the coil if the galvanometer (in-person) or the voltmeter (PhET) has a positive or negative deflection based on being observed from the right side of the coil.

Once the students have established this, I give them a series of tasks that they have to perform and to record what they observe. The tasks are listed in the table below:
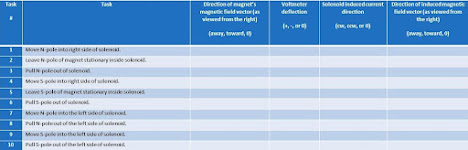
When we were doing this in-person, I asked the students to perform Task 1, to record what they observed, and then we all, as a class, discuss the observation. This exercise was helpful especially to students who were still unsure on what to do and what they should be observing. So this first tasks often clarified further what they needed to perform and what they should observe. For remote classes, this is not that easy mainly because I don't quite see what they students are doing and what they are observing. They are also doing this in their separate Zoom breakout rooms. They have a chance to discuss with members of their group, but I am not always there to double-check what they are observing. I do, however, get to see what they are recording because the table above is posted on a Google Slide document that I give them. So I can see every entry for each group and able to step in if I see something not quite right.

In any case, the students for in-person session perform the task one step at a time, and each time, we all discuss the observation. Remember that I have not told them anything about Lenz's law at all. All they are doing at this stage is performing a task and recording the corresponding observation.

By the end of this activity, both the in-person and remote students will have a set of observations for each of the tasks performed. This is where it gets interesting. I then instruct the students to discuss with their group members on how to come up with a set of rules or "laws" to accurately describe the behavior of the current in the coil in relation to what the bar magnet is doing. In other words, I want the to come up with a written description of Lenz's law.

Of course, I give them hints. The biggest hint is for them to consider the induced magnetic field in the coil. By that point, they have learned that a current in a coil or solenoid generates a magnetic field. If there is a deflection in the galvanometer/voltmeter, then there must be a current in the coil. The positive or negative deflection indicates the direction of the current in the coil, which in turn indicates the direction of the induced magnetic field in the coil.

From my experience in doing this for several semesters, only about 1/4 of the students were able to come up with a description that had a close resemblance to Lenz's law. Many of them struggled not just in understanding what they observed and what the "laws" were, but also in communicating accurately and clearly what they intended to say. The latter is a very common problem for many students trying to write scientific prose.

However, regardless of whether they managed to successfully come up with their own version of Lenz's law, I find that this exercise demonstrates this principle a lot clearer than if I just simply spew out the material in a lecture. Even if the students could not communicate clearly what they understood, most of them actually had some realization of what it is. To me, this is the biggest stumbling block in understanding Lenz's law, which was the impetus for me to present this topic in this manner.

The PhET application allowed me to do almost the same activity online as the one I do in-person. That is a very good thing!

Zz.


Saturday, March 19, 2022

My Favorite Web Applications - Part 3

Previous posts:

My favorite web applications - Part 1

My favorite web applications - Part 2

Continuing with this series, here is my next favorite web application. This is a virtual experiment on measuring the specific heat of an object. The fun thing about this particular application is that (i) it is very similar to what we normally do in a real experiment and (ii) one can also use the step-by-step instruction as part of the experimental procedure, thus the name "Guided Specific Heat.... ".

Similar to the force table experiment that I cited in Part 2, this one also has randomized values for each person going through it. It randomizes the mass of the cold water, the mass of the object, and uses different specific heats. Each student doing this online will have a different answer.

When I assigned this to the students during our remote sessions, the students had to fill in all the information obtained during each step, i.e. measurement of the mass, etc. Then, during the actual measurement, once it stopped, the students had to do a screen capture of the graph of Temp. vs. time to paste in their report. They then had to show their work on how they arrived at the specific heat value of the object. If they entered the correct answer, the application acknowledges that and they should also do a screen capture of that to paste in the report. If they got it wrong, then they had the option of either submitting what they had and take the deduction for the wrong work and answer, or redo the experiment from the very beginning. They get to do this as many times as they wish until they get it right.

I also added an extra part where I asked them to think of the kind of errors and uncertainty in the experiment, especially if this were done in real life.

To double-check the students' answers, I created a spreadsheet where all I needed to do was to enter the mass of the object, mass of the cold water, and the final temperature. 

I like that each student will have a different answer. It added an extra layer where they could not just copy off each other's work directly. The experimental procedure is also almost identical to one of our experiments on specific heats anyway, so I didn't have to make huge modification to the instruction.

Now that we have gone back to f2f classes, I'm using this exercise as part of a homework assignment.

Zz.

Wednesday, March 09, 2022

Share It, Don't Split It?

This is a rather eye-opening paper on the impact of how students work together during lab work. It seems that when students divide specific tasks among themselves, there is less equitable benefits in terms of physics interest and self-efficacy. This is in comparison to the group of students (Group B) who tend to share the same tasks or take turns in doing different tasks during the experiment.

In particular, we find that Group B-style work is especially beneficial for women, a group that has historically been marginalized in physics. Thus, improving the equity of group work may be a productive step in efforts to improve equity in our field. In this context, we view equitable learning as providing equitable access to physics classes, inclusive learning environments that meet the needs of all students equitably, and learning outcomes that are not biased toward or against any groups of students. In order to improve equitable learning, we encourage educators to find ways to structure student learning to support Group B-style collaborative learning experiences for students.

Of course, this is easier said than done. The tendency here is to let the students themselves decide how they will work together. This means that if we want the students to adopt the working style of Group B, the instructor and the course structure itself has to coerce the students into it. The paper offers several suggestions on how to do this, which you may read in the paper.

This is something that I need to think about more carefully. Is there a compelling enough of evidence to support such an assertion? And if there is, have there been verified and tested methodology that accomplished the stated goals? I sometime feel that, as educators, we are being inundated with a "flavor of the month" of what we need to do for the students in the name of inclusion, equality, equity, accessibility, etc..... etc, and how to execute all that remotely even!

Still, as someone who emphasizes on experimental work quite a bit (being an experimentalist myself), I will need to read this paper a bit more and see if there are any of the recommendations that I can easily do without much modification to the current structure. I know that I have always try to limit the number of students in a group (typically 2 students per group if we have sufficient equipment), so that no one ends up just sitting there and doing nothing but watching and writing down numbers. But this paper may force me to figure out some ways to encourage each student to take turns to perform the experiment and experience every part of the work.

Something to think about, I suppose...

Zz.

Tuesday, March 08, 2022

My Favorite Web Applications - Part 2

 Previous posts:

My favorite web applications - Part 1

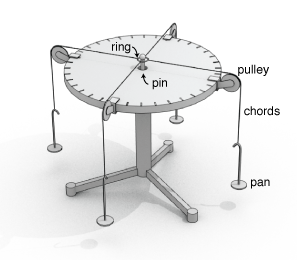
It is rather appropriate that the next web application on my list can actually make full use of the vector calculator that I mentioned in a recent post. Many of you may be familiar with the force table in a General Physics course lab. It is a contraption that looks similar to the picture below.

force tables

It actually is a rather useful apparatus to demonstrate vector addition and the powerful and convenient method of vector addition using components. Of course, when I assigned this to my students, we didn't use any vector calculator. The students had to calculate the components and find the resultant vector themselves. But this was also the situation where the students encountered the issue with knowing the correct angle that I mention in the vector calculator post. The only difference being that the visual "obviousness" here is more apparent than just looking at the numbers on an Excel spreadsheet.

When we went remote, I was lucky enough to come across this website that had a virtual version of the force table. In fact, other than not having the students struggle with knowing what weights to use, where to clamp them, and how to set up the pulleys, this exercise is quite similar to what I would normally do in class. I had to do only minor rewrite to my lab instruction to incorporate this web exercise.

The one thing I like about this app is that the situation is different for each student, i.e. the magnitudes and directions are unique to each student. Therefore, while they can consult with each other, each student still has to do his/her own calculations to get the answer. The students are given the instruction that they need to do this until they get it right, even if they exhausted all the tries and have to get the web to regenerate brand new set of forces and angles. Once they get it right, they have to do a screen capture of the acknowledgement page, and paste that in the report along with the working done to arrive at the correct answer.

The only thing I wish this web app has is the ability to specify the number of weights (or vectors) in use. In my in-person lab, I had the students start with just one vector, and they have to construct an opposing vector to get the equilibrium condition (trivial, of course, but you'd be surprised at the number of students who had to think about how to do this). Then they move on to having 2 given vectors, and finally 3 vectors, which is what we have in the web app. By doing this gradually, the students realize that they first need to find the resultant vector, and once they have that, all they need to do to get the equilibrium condition is to create another vector of equal magnitude but in opposite direction to the resultant.

Nevertheless, this is a useful web app and something that I intend to use even for in-person instruction.

Zz.


Friday, February 04, 2022

What An Experiment Can and Cannot Tell You

When classes had to go remote or online due to the pandemic, the biggest issue for general physics courses was, among other things, the labs. These courses were not designed to be done remotely, and so the labs could not simply be adopted for remote learning. This is in contrast to online general physics courses that were designed to be done remotely and have lab kits designed for such courses.

I had to resort to using virtual web applications and simulations at first, making extensive use of the PhET website, until I discovered Pivot Interactives. But this is not about that. Rather, I also had to think a little bit of actual activities that a student could do using simple, household stuff, that can either be their "experiment", or a supplement to any simulation or online labs that they did.

When we started a topic on electric charges, I used this as an in-class activity to supplement the lecture as a demonstration of static charges. When we went remote, I changed it so that it became an experiment that the students could do at home because it uses only one thing: sticky cellophane (Scotch) tape. I'm sure this is familiar to many people, but I'll describe briefly what is involved.

You take 4 strips of sticky tape, each about 6 inches long. Fold under one end of each tape so that that end doesn't stick to anything and acts as a convenient handle.

Take one tape and stick it to a flat surface such as a table or desk. Mark one end of it with a "B1" for bottom tape 1. Take another tape and stick it on top of B1. Mark that tape as "T1" for top tape 1.

Do the same for the other two tapes, but mark them as "B2" and "T2" for bottom and top tape 2, respectively. You should end up with something similar to the picture above.

Now take T1 and rip it off B1. Stick the sticky, unfolded end of T1 to the edge of the table so that most of the tape hangs freely.

Pull tape B1 off the table. Hold B1 at the folded end and let it hang down freely. Slowly, move it closer to tape T1 but don't let them touch. What do you see?

Next, attach the sticky, unfolded end of B1 to the edge of the table, very much like what was done to T1.

Rip tape T2 off B2.

Hold T2 at the folded end and let it hang down freely. Once again, slowly move it closer to T1 and observe. Repeat this by moving T2 closer to B1 and observe.

Attach T2 to the edge of the table again, the same as what you did with T1 and B1.

Pull tape B2 off the table, and repeat the process with T1, B1, and T2.

So that is the entire "experiment". The students had to describe clearly what they observed. I emphasized that this part should be just observational. I was not looking for explanation yet. The aim here is to distinguish between observations, which if valid are "facts", versus explanation which can be interpretation based on our understanding.

If the experiment was done carefully, the observation should be like this:

  1. When B1 is brought closer to T1, the two tapes appear to attract each other.
  2. When T2 is brought closer to T1, the two tapes appear to repel each other.
  3. When T2 is brought closer to B1, the two tapes appear to attract each other.
  4. When B2 is brought closer to T1, the two tapes appear to attract each other.
  5. When B2 is brought closer to B1, the two tapes appear to repel each other.
  6. When B2 is brought closer to T2, the two tapes appear to attract each other.

Those are the observations. So the next part is the explanation for the observation. Here, we invoke our understanding of the nature of forces on charges. We know that like charges repel, and unlike charges attract.

Since the two T tapes repel each other, we can conclude that they have the same type of charge. Similarly, since the two B tapes repel each other, we conclude that they have the same type of charge. Next, since the T tapes seem to attract the B tapes, then they have opposite charges. Thus, what we have in terms of the type of charge is

T1 = T2

B1 = B2

T1,T2 have opposite charge to B1,B2.

Now, if given NOTHING ELSE, this is as much as you can say about what you can get out of the experiment. But somehow, every single time I've had students do this, a few of them inevitably went a step further (or maybe a step too far?) and managed to conclude that tapes T1 and T2 have a particular type of charge (say, negative), which means that B1 and B2 tapes have positive charge. I don't quite know how they arrived at this conclusion.

Rather than just telling them that they were "wrong" in the sense that they could not deduce the nature of the charge just from the experiment alone, I decided to use this as a class discussion topic. My main question was that, to what extent can you squeeze all the information out of an experiment based on the observation, and when have you gone a bit too far?

Nothing in the observation alone tells you the type of charge on each tape. What you do get is the relative type of charge when you compare one tape against another. You can't tell which one is positive and which one is negative simply from the observation. You can only tell if two tapes have the same or opposite charges. That's it. That is the limit of the valid and verifiable conclusion that you can draw out of the observation. The experiment tells you nothing about the type of charge that each tape has.

I then asked the students if they can suggest what we can do next to actually determine the type of charge on each tape. Certainly, if we have a "reference" charge, something that we know that has a particular type of charge, then this can certainly be used to determine the type of charge. For example, rubbing wool onto a glass rod has been shown to induce a net positive charge on the rod. So the rod could be used as a reference. But I asked the students whether it is necessary to use this reference charge on ALL of the tapes, i.e. check what happens if they bring this reference charge to each individual tape. The purpose here is to use the inductive deduction, where one only needs to check with just one tape, and knowing that tape's relationship with the others, automatically determines the type of charge on all of them.

But the key thing here is that the experiment by itself can only tell you information about what is going on up to a point. Making a deduction that goes beyond that means that you are either guessing or speculating. While that is fine if you realize that that is what you are doing (we often do that in science research), it should not be confused as facts given by the experiment. They are not. The ability to know the type of charge on each tape requires a reference. Consequently, the validity of our determination of the type of charge on each tape depends on the validity of our knowledge about the reference charge. If, for some reason, our understanding of the reference charge is wrong, then our conclusion about the type of charge on each tape will also be wrong, BUT, our observations are not! The observations are facts, and they remain valid even if we wrongly assigned the type of charge on each tape.

This very simple exercise, and the lessons that can be learned from it, have huge implications to our world today. This is because a lot of people have a lot of problems deciphering and distinguishing between valid facts and conclusions/speculations. Often times, those two are intermingled until one can no longer tell which is which. I've seen people arguing about the conclusions, and somehow, that undermines the validity of the facts that they were based on, very much like wagging the dog. Even worse, when the "facts" are shown to be flawed or discredited, somehow the conclusions that were based on those facts remained alive and well!!

As science educators, we need to make a conscious effort to impress upon the students that science education is not just about learning the science. It is also learning how to think and the process of making systematic and rational deduction based on the nature of the facts.

Zz.